 Software
Data Process and Mapping System
Supports Multiple Data Formats
Database support: CSV format (all ASCII format), Excel format, Access format data importand export.
Image support: Bitmap, JPEG, PCX, PNG, TIFF, PDF format.
Vectordata support: * .shp format for ArcGIS software, *. dxf format for AutoCAD software, *. mif, *. mid and *.tab formats for MapInfo software.
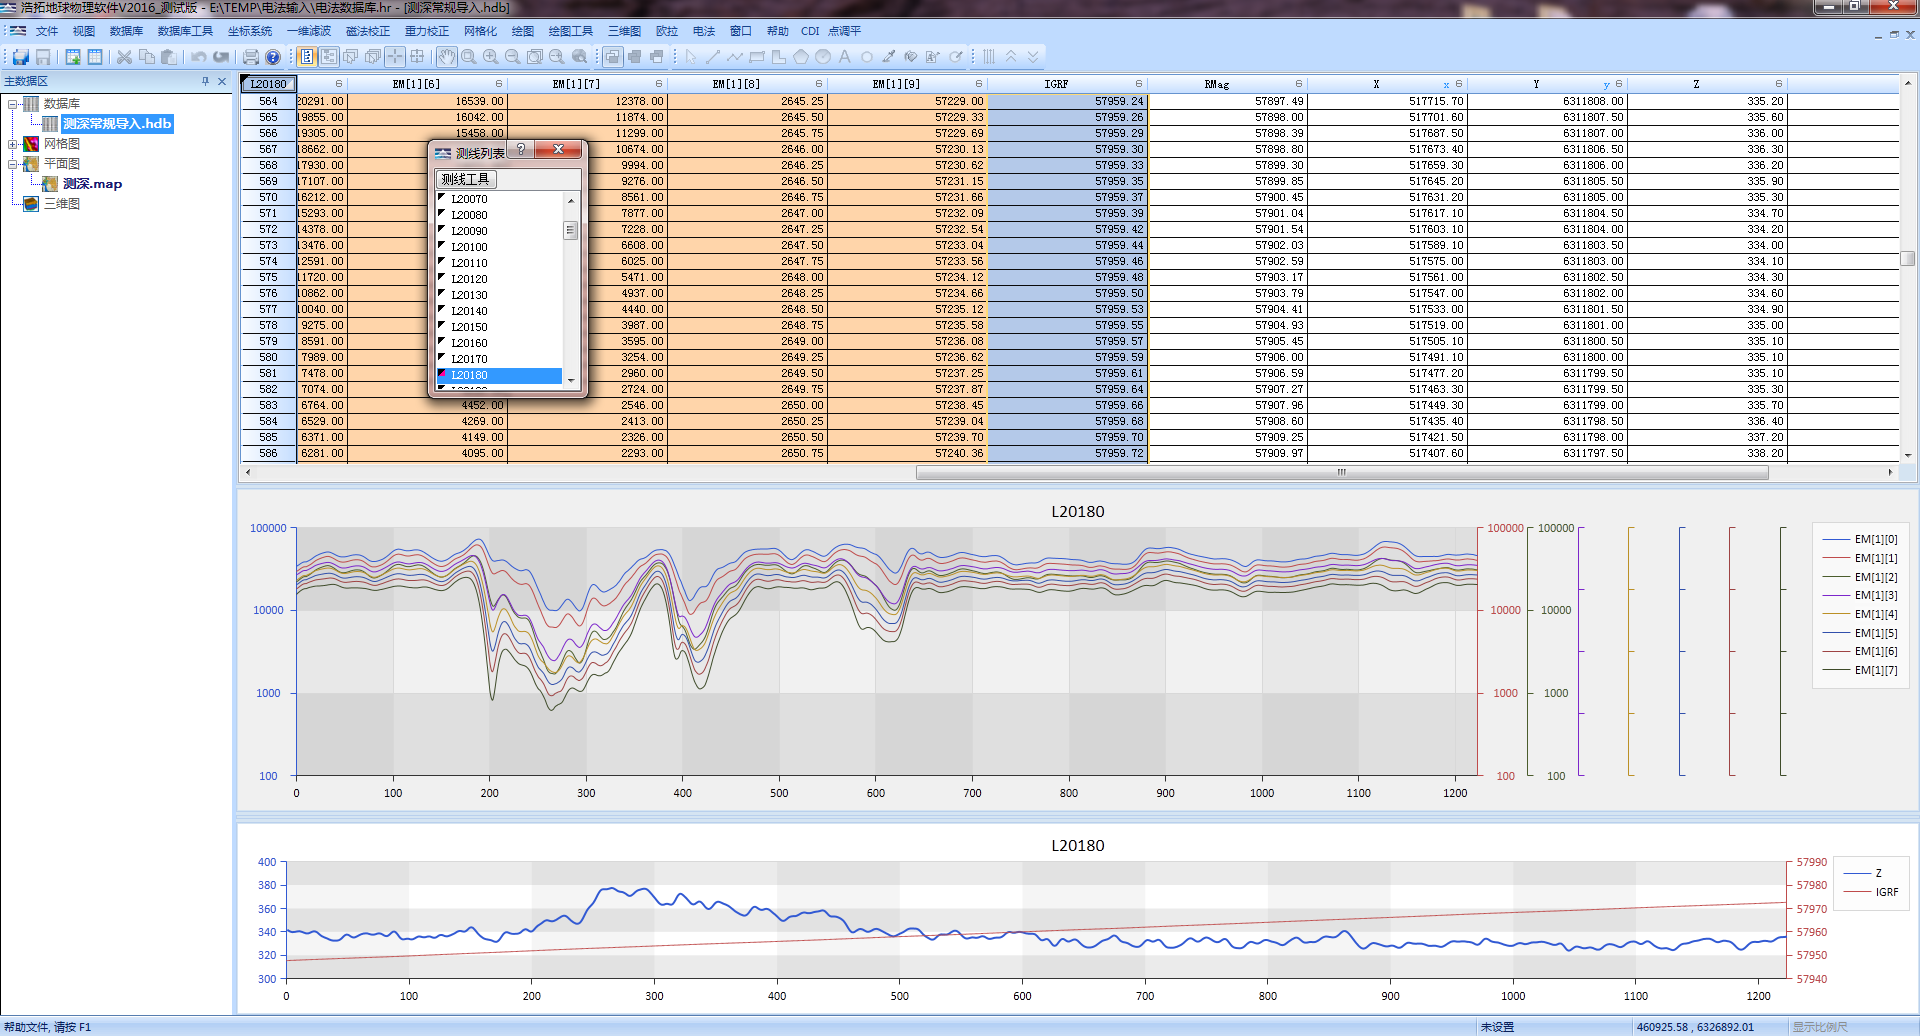
Profile Drawing
The profile line drawn from the channel data can clearly show the distribution of each point data in this channel. The Horin Software can draw multiple profile lines in the same display area.
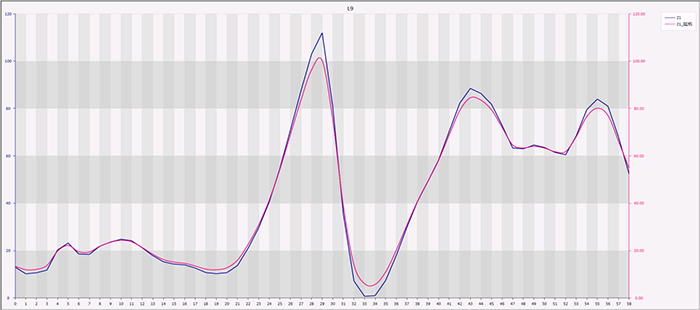
Profile Curve
Coordinate System
You can set arbitrary coordinate system for your database in the coordinate system. It is also very convenient to perform coordinate conversion between "geographic coordinates" and "projection coordinates", and the operation is very simple.

Coordinate Conversion
Data Process Functions
The database of Horin software is a professional geophysical database. It mainly contains three types of functions: "database function", "survey lines function" and "channels data function". The purpose of the database is to make data process more efficient and easier.

Database Interface
Gridding
There are 4 methods of Gridding in Horin Software, which are "Inverse Distance Weighting","Bidirectional Spline", "Kriging" and "Minimum Curvature". The grid data can be used to generate a rendering map by calling the Horin Software palette, or it can be directly used to draw contour lines. Horin Software also supports import and export of grd data in Surfer format, grd data in Encom format, and grd data in ArcGIS Ascii format.
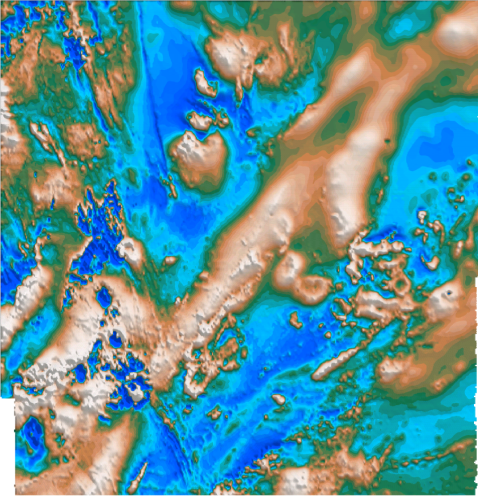

Grid Map
Grid Tool
Horin Software includes multiple grid tools, such as "Grid Knitting ", "Grid Merge", "Grid Clipping", "Grid Resampling","Data Extraction of Arbitrary Line from Grid " "Expansion"and so on.

Grid Institching
Professional 3D Modeling System
Horin 3D modeling system has multilayer structure. Every layer can map, analysis and output individualy. Its operation and management are intuitive and simple.

3D Modeling System
Located Image
3D images of differernt strike, dip and shape can be loaded. They can be precisely located.


Located Image and Drape Image
3D Grid and Symbol Map
Horin can display 3d elevation grid undulations of different stratigraphic interface, including surface and seabed.


3D Grid 3D Symbol
Voxel

3D voxel, isosurface, thick-slice and threshold
3D Drillhole Display
Drillhole data, including collar, survey, litholigy and assay, can be imported to Horin. You can display all kinds of 3d drillhole map, such as 3d drillhole traces, 3d histogram of lithology and 3d sector chart of assays.

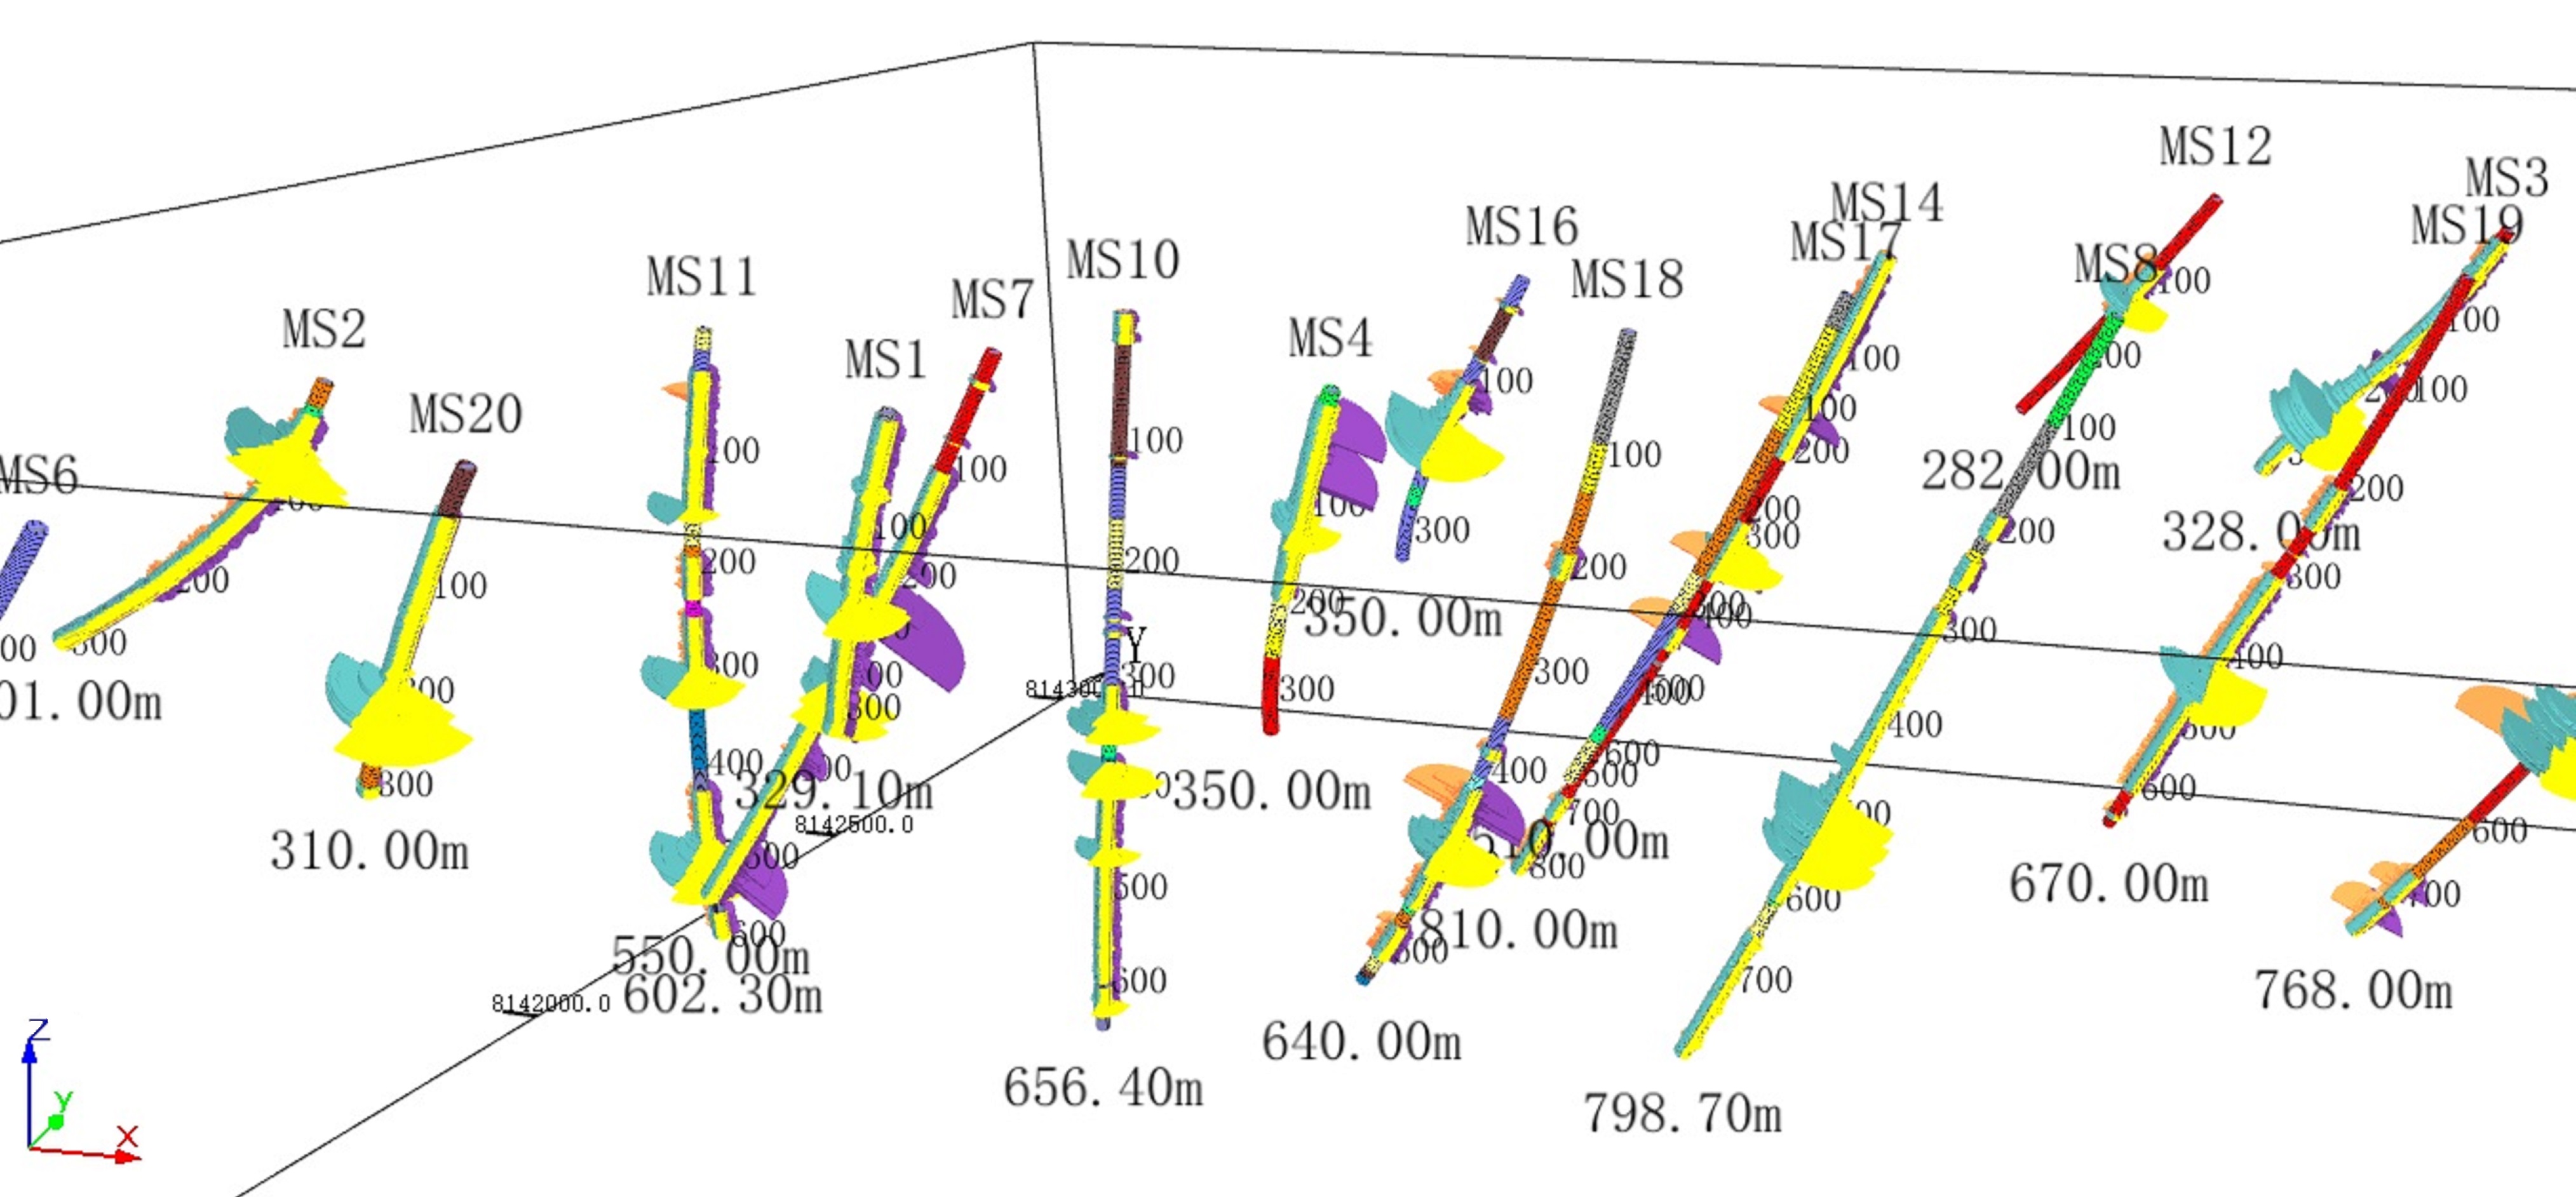
3D drillhole-3d histogram 3D drillhole-3d sector chart
3D Vector Model
Create vector polygons human-computer interactly in several sections. Then interpolate these polygons into 3D solid models. You can Intuitively visualize your 3D interpretation results in 3D viewer.

 3D Interpretation Results 3D Faults
3D PDF and Video Output
Horin 3D map can be exported as 3D pdf and video formats. When users report their work, the 3D model can be displayed directly through PDF files and videos, which greatly improves the reporting effect of the project.

Output your result as 3D pdf format
3D Comprehensive Display
You can comprehensively display and model 3D elements, such as 3D undulating grid, drillhole data, 3D vector, 3D voxel, 3D isosurface and 3D slice,etc.
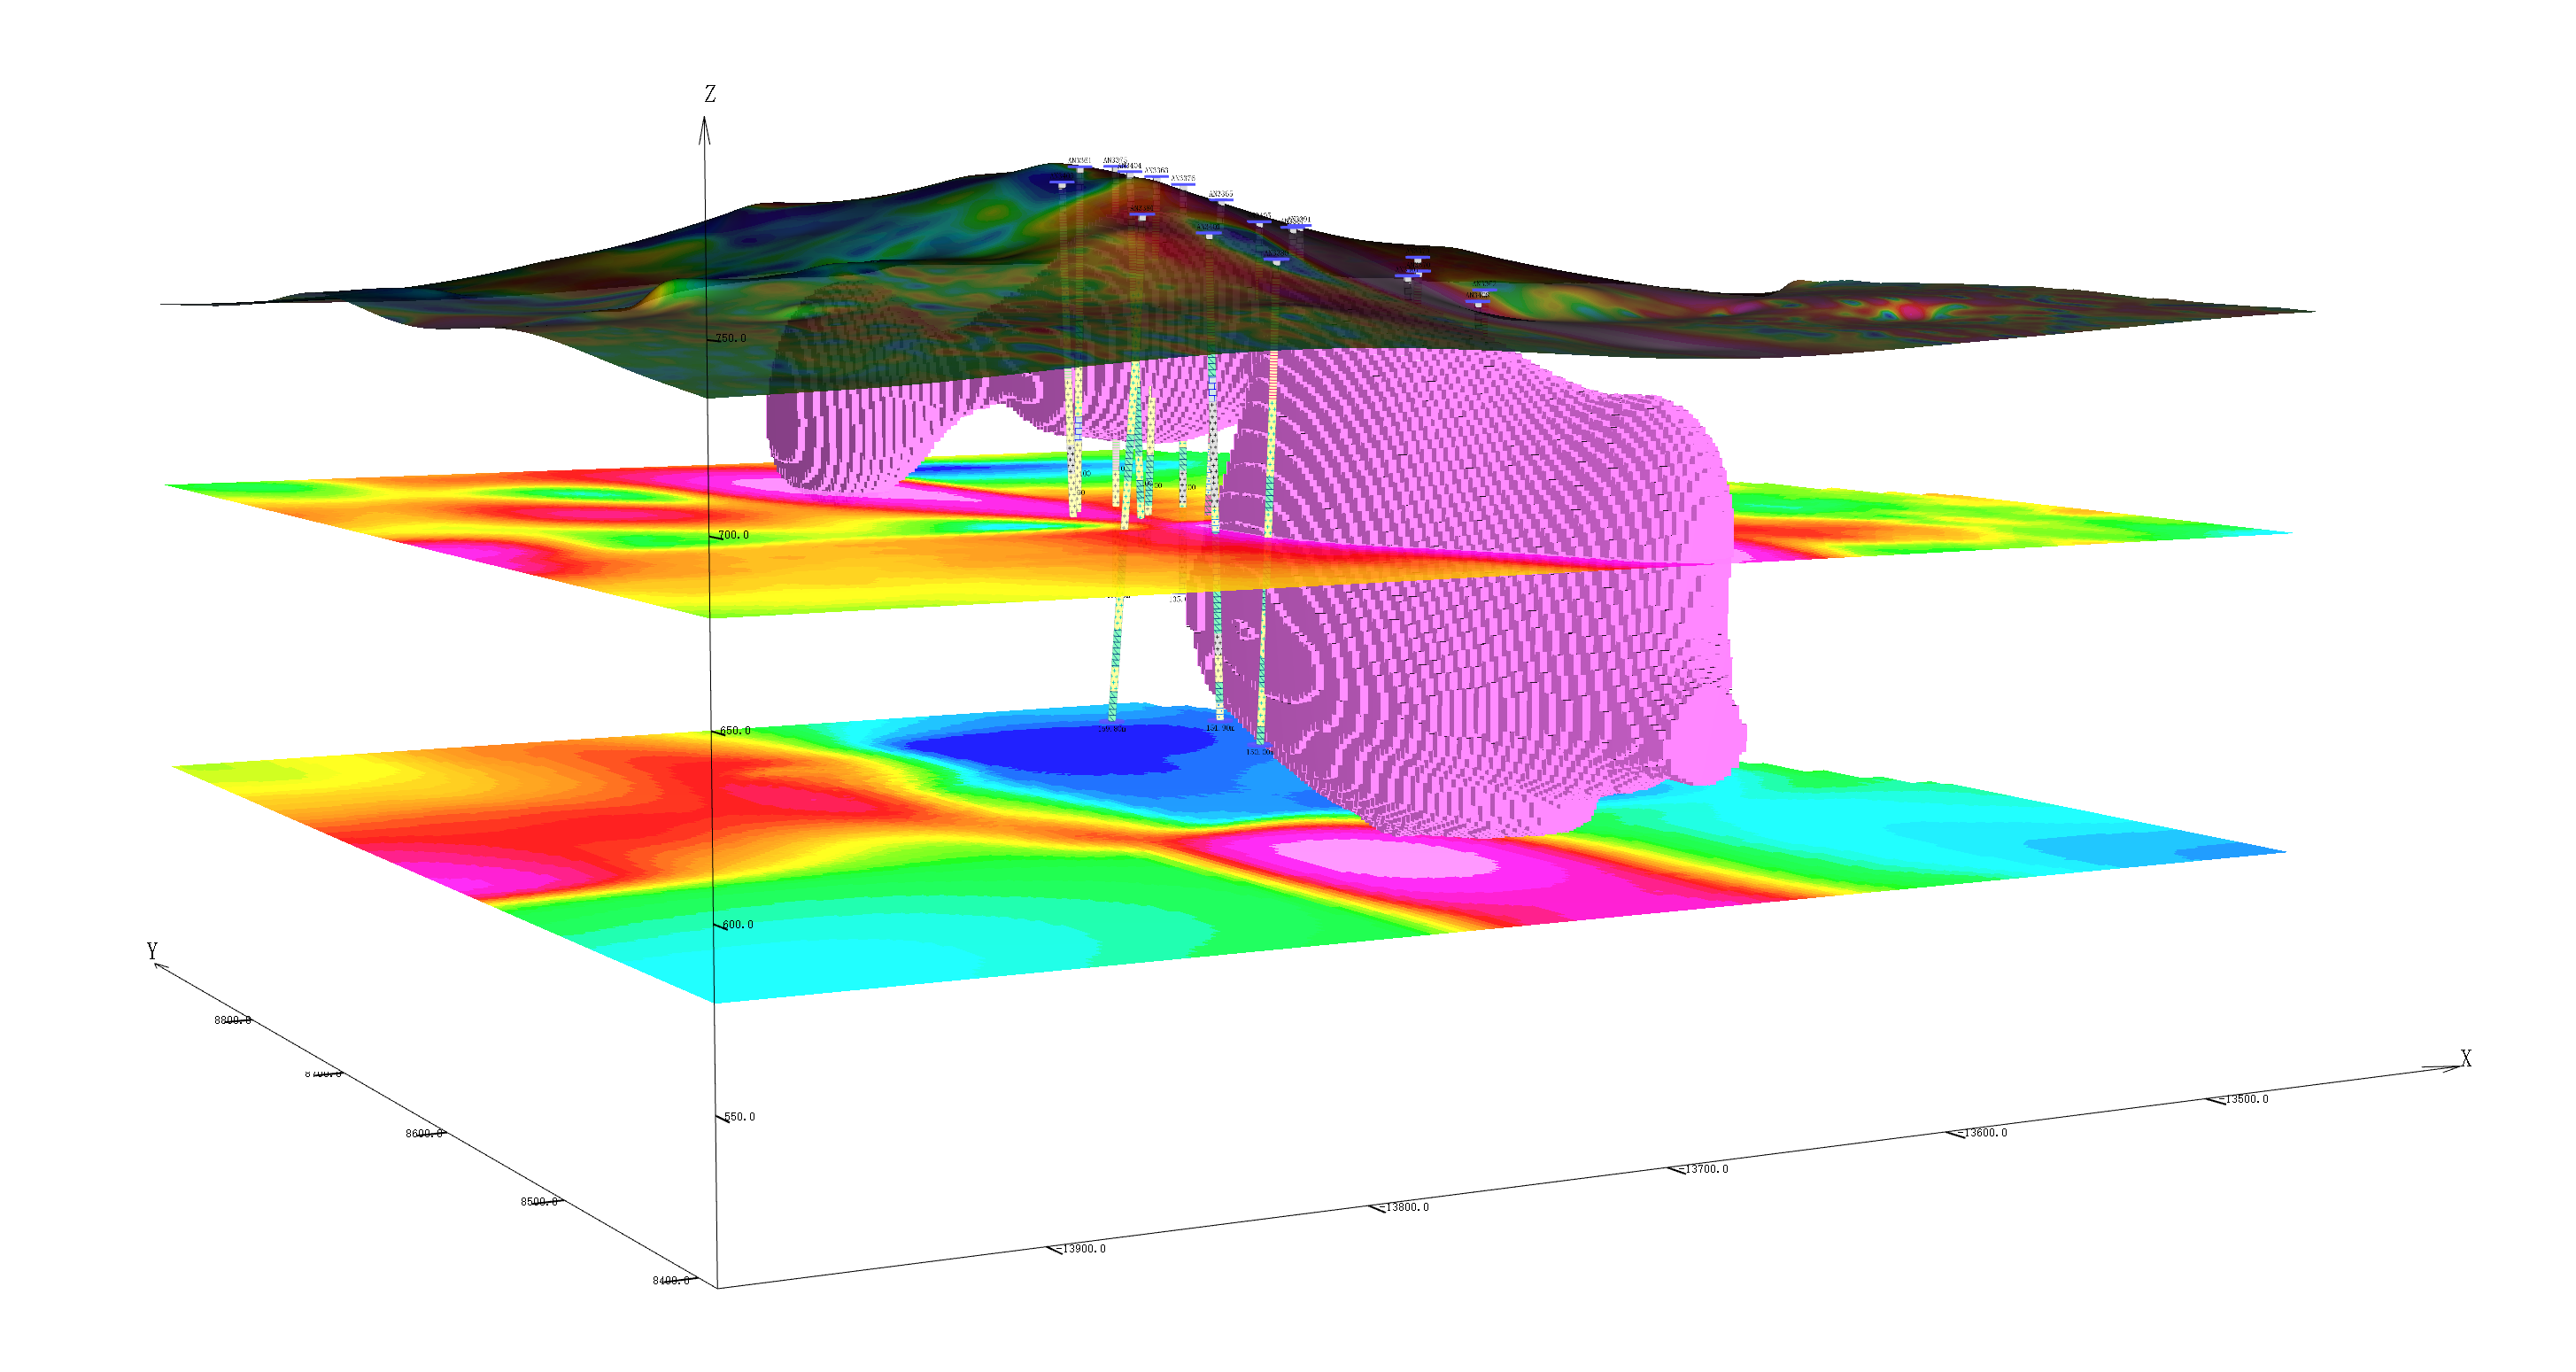
3D Comprehensive Display
Data Process and Mapping System
Data Import and Export
Database of Horin Software is a professional geophysical database, which conforms to the user's usage habits. The structure is layer storage, and the survey line datais stored by page. The survey line data is composed of survey point data, and each survey point contains different data attributes. As long as you know the format of the collected data, you can import your data into the database of Horin Geophysical Software to perform various operations easily.
Image Import and Export
Horin Software supports the import of multiple pictures. At the same time, you can output maps as pictures in various formats at any resolutions.


Image Import Image Export
Vector Map Import and Export
You can import/export the vector map in 4 kind of formats, which will greatly saves your time, avoiding the software compatibility problem.


Horin Stacked Profile Export ArcGIS Format
Professional Geophysical Database
Horin Geophysical Database is a professional geophysical database designed and developed by Horin Company for professional users. From data import, sorting,statistics to data drawing, output, and printing, Horin database is implemented in a professional way.
Database Interface
Setting and Transformation of the Coordinate System
Horin Geophysical Software has a built-in coordinate system, which can set, modify, and transform the coordinates. The conversion between projection coordinates and geographic coordinates can be performed for any survey in world. The operation interface is simple and clear.


Coordinate transformation Custom coordinate system
Quality Analysis and Quality Control
There will always be some jump points in the original collected data, which will greatly affect the processing results when making data processing. You can use the database profile line and survey line pick point function to quickly perform quality analysis and quality control on the data, delete the jump points from the database at any time, or correct them in real time.

Eliminate Tares of Profile Eliminate Tares through Database and Floor Plan Linkage
Extract Data Quickly
There are two ways to quickly extract the interested region: "Extract from Database" and "Extract from Grid Map".
Extraction from database: You can mark the interested area in the map by the polygon file,and then directly extract the corresponding data from the database and store it in a new database.
Extractionin grid map: You can interactively crop the grid map to obtain a new grid databy the polygon file function .

Mark the interested area in the map Extract interested data and store it in a new database Gridding of data of interested area
Data Process-Survey Line Clipping
There are 8 kind of survey line clipping functions in Horin Software,which can meet the needs of survey line clipping and processing for all kinds of disorderly survey line.

Original Lines (Not Clip) Clip Effect
Color Palette
According to your needs, the color palette can be used to assign arbitrary colors, color transform methods, and lighting to your grid, and you can preview your grid in real time.

Color Palette
Contour Drawing
Horin Software can draw colored contours, which is a way of multi-data integration and improve the expressiveness of the map. You can also add the labels for contours along the line when you draw an arbitrary line across the contours.

colored contours add labes along arbitrary line across the contours
Stacked Profile Map
You can draw gradiented colors stacked profile map in Horin Software, up to 64 color gradient. Horin stacked profile is natural, bright, beautiful with more obvious abnormality. It is a very useful function whether you submit it as achievement or do manual interpretation. At the same time, Horin Software can draw the legend of Stacked Profile map, and the color of the legend can also be displayed ingradient. In addition, the drawing speed of the Stacked Profile of Horin Software is very fast, you can do it by one-click drawing.

Secondary Development
We designed a secondary development interface for users. You can directly embed your own software functions into the platform of Horin Software as modules by the "Add Module" function. It is easy and fast. And we can also develop some geophysical customized functions for you, so that you have your own exclusiveversion.

3D Map
You can create 3D views in Horin software, including 3D topography surface, 3D contour, 3D symbols, voxel, 3D slice and Isosurface. Undert he same 3D project, multiple 3D surfaces/voxels can be viewed. Each 3D surface/voxelcan be changed with a color template. You can adjust their relative position andvertical scale. Drawing a 3D view is so easy in Horin, you will quickly andeasily display all your data in a 3D view.

3D map
Voxel
3D voxel, isosurface, thick-slice,threshold
版权所有:北京金浩林勘探技术有限公司 京ICP备12050676号
公司地址:北京市海淀区苏州街49号院7号楼610/616室 联系电话:010-62611285 服务投诉电话:13521903951 传 真:010-62611285 公司邮箱:sale@horinexplore.com
 Current Position:
  客服
客服